Image Alignment and Normalisation for MR-DUAL
SPECT Imaging in Epilepsy
Because the amount of radioactive tracer reaching
the brain during the two studies is unknown, the relationship between the
counts emitted by corresponding tissues in the two scans is unknown. In
simple terms, the overall brightness of the two scans is different:
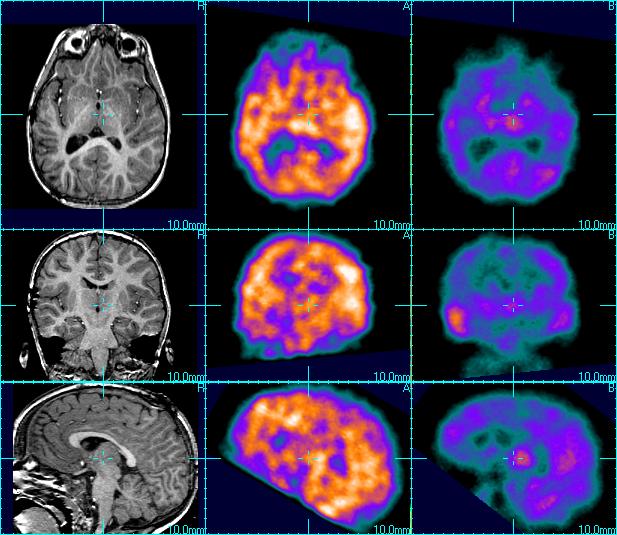
Orthogonal slices through registered
MRI (left), SPECT scan 'A' (middle column) and SPECT scan 'B' (right column).
The two SPECT scans are displayed
with the same colour table and intensity range to illustrate the overall difference
in tracer reaching the brain during the two studies.
To reveal localised changes we must normalise
the uptake in the two SPECT studies. The key issue here is that there are
localised regions of change in the uptake of tissue in the two scans and
also changes due to imaging artefact. The problem is to recover a normalisation
estimate for the majority of unchanged tissue in the brain . Once normalisation
is carried out, subtraction of the two sets of image values can reveal possible
regions of epileptic fous:

Orthogonal slices through registered
MRI (left), SPECT scan 'A' ,SPECT scan 'B' (normalised to 'A') and their difference
(displayed with a green-red
colour table to illustrate increase and decrease respectively).
Note: Regions of increase in
the temporal lobe and also reconstruction artfeacts in the last slice of SPECT
'A'.